These beautiful correlations and inverse correlations will amaze you and give you a feeling that making money in stock market is a child's game. Have no doubt in your mind, most of the time it might actually be !
Archies and the festive December
Because of December being festive & gifting season, checkout in the graph below, how Archies used to spike up every December every year for several years except for 2008 which was a global recession period and obviously luxury spending & gifting was out of the picture due to many people losing their jobs and keeping the year end celebrations muted. Later on this became too obvious and the pattern became more and more deceptive sometimes falling in December and spiking in February for valentines and later on even that became slightly unreliable but only after being consistent 6-7 years !

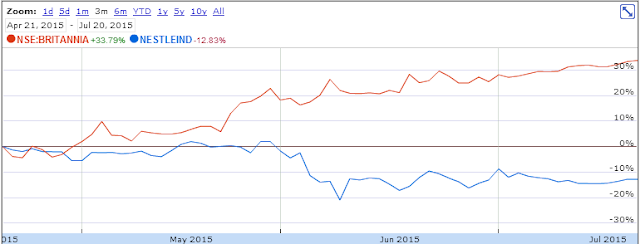
Nestle Vs Britannia
Nestle Maggi was banned after FSSAI found high amounts of lead and MSG in the noodles (yet to be proven). Nestle had to stop maggi production due to these allegations which immediately created excess supply of dough and completely pulled down the demand for it leading to 10% correction in price of dough which in turn benefited bread, biscuit & pizza makers like britannia and dominoz (who also use dough as raw material) causing their share prices to surge. In the graph given below checkout how initially both Nestle and Britannia are highly correlated (both being in similar consumption sector) but towards the end of may both stocks start moving in completely opposite direction with Nestle crashing down due to maggi ban and britannia outperforming at an accelerated pace both due to less competition and cheaper raw material for biscuits due to ban on maggi.
Gold Vs SSE Comp
During the Jun-July'2015 crash of the Chinese stock market, investors started selling gold even at 5 year lows to add to the margin requirements in their equity positions, leading to the steep fall in the gold price. Below is a graph of SSE Composite Vs GOLD ETF. Checkout the crossover between GOLD ETF plunging and SSE Comp rising pointed by the arrow. The inverse correlation validates the theory of money moving out of Gold ETF's and being invested into equity in the Chinese market.

Crude Oil Vs Asian Paints
Crude Oil derivative is a major raw material used for paint manufacturing. As shown in the graph below, Asian paints kept rising in a beautiful inverse correlation as crude kept dropping due to recession in EU nations (Greece debt default) and after nuclear deal with Iran leading to fears of oversupply in the crude market. Other factors for crude drop included alternate fuel sources like shale gas and the politics of suppression of crude producing nations like Russia besides cutting the income of the terrorist group ISIS which was selling crude obtained by capturing crude stations in Iraq & Syria to fund their terror operations.

Archies and the festive December
Because of December being festive & gifting season, checkout in the graph below, how Archies used to spike up every December every year for several years except for 2008 which was a global recession period and obviously luxury spending & gifting was out of the picture due to many people losing their jobs and keeping the year end celebrations muted. Later on this became too obvious and the pattern became more and more deceptive sometimes falling in December and spiking in February for valentines and later on even that became slightly unreliable but only after being consistent 6-7 years !

Nestle Vs Britannia
Nestle Maggi was banned after FSSAI found high amounts of lead and MSG in the noodles (yet to be proven). Nestle had to stop maggi production due to these allegations which immediately created excess supply of dough and completely pulled down the demand for it leading to 10% correction in price of dough which in turn benefited bread, biscuit & pizza makers like britannia and dominoz (who also use dough as raw material) causing their share prices to surge. In the graph given below checkout how initially both Nestle and Britannia are highly correlated (both being in similar consumption sector) but towards the end of may both stocks start moving in completely opposite direction with Nestle crashing down due to maggi ban and britannia outperforming at an accelerated pace both due to less competition and cheaper raw material for biscuits due to ban on maggi.

Gold Vs SSE Comp
During the Jun-July'2015 crash of the Chinese stock market, investors started selling gold even at 5 year lows to add to the margin requirements in their equity positions, leading to the steep fall in the gold price. Below is a graph of SSE Composite Vs GOLD ETF. Checkout the crossover between GOLD ETF plunging and SSE Comp rising pointed by the arrow. The inverse correlation validates the theory of money moving out of Gold ETF's and being invested into equity in the Chinese market.

Crude Oil Vs Asian Paints
Crude Oil derivative is a major raw material used for paint manufacturing. As shown in the graph below, Asian paints kept rising in a beautiful inverse correlation as crude kept dropping due to recession in EU nations (Greece debt default) and after nuclear deal with Iran leading to fears of oversupply in the crude market. Other factors for crude drop included alternate fuel sources like shale gas and the politics of suppression of crude producing nations like Russia besides cutting the income of the terrorist group ISIS which was selling crude obtained by capturing crude stations in Iraq & Syria to fund their terror operations.

cool
ReplyDelete